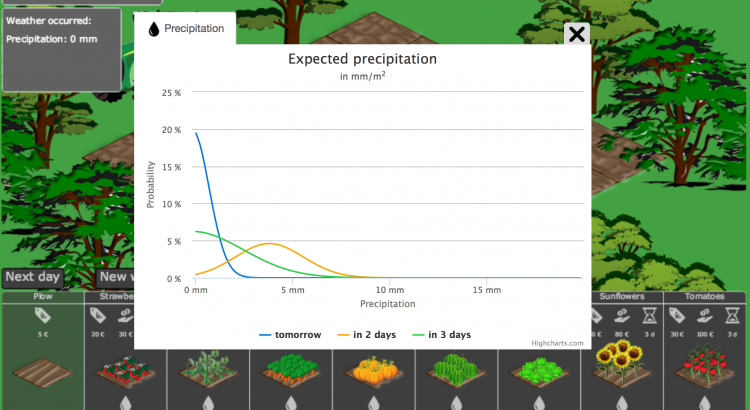
Non-experts are confronted with uncertainty of predictions everyday when, e.g., using a navigation device or looking at the weather forecast. How- ever, there are no standards for representing uncertain information and repre- sentations could be easily misleading. Thus, we selected twelve representations that provide different levels of uncertainty information. We compared the repre- sentations in an online survey with 90 participants where we asked participants to judge their support in decision-making, familiarity, easiness to understand, and visual appeal. We further evaluated the four most promising representations in a turn-based online game. Players had to make decisions in a farming scenar- io based on a displayed weather forecast. The results of the survey and the game indicate that a function graph of a probability distribution function is the best way to communicate uncertain information. Nevertheless, our results also show that presenting more uncertainty information does not necessarily lead to better decisions.
Slides from Interact 2015:
Interact15_RepresentationsForUncertainty
